The task
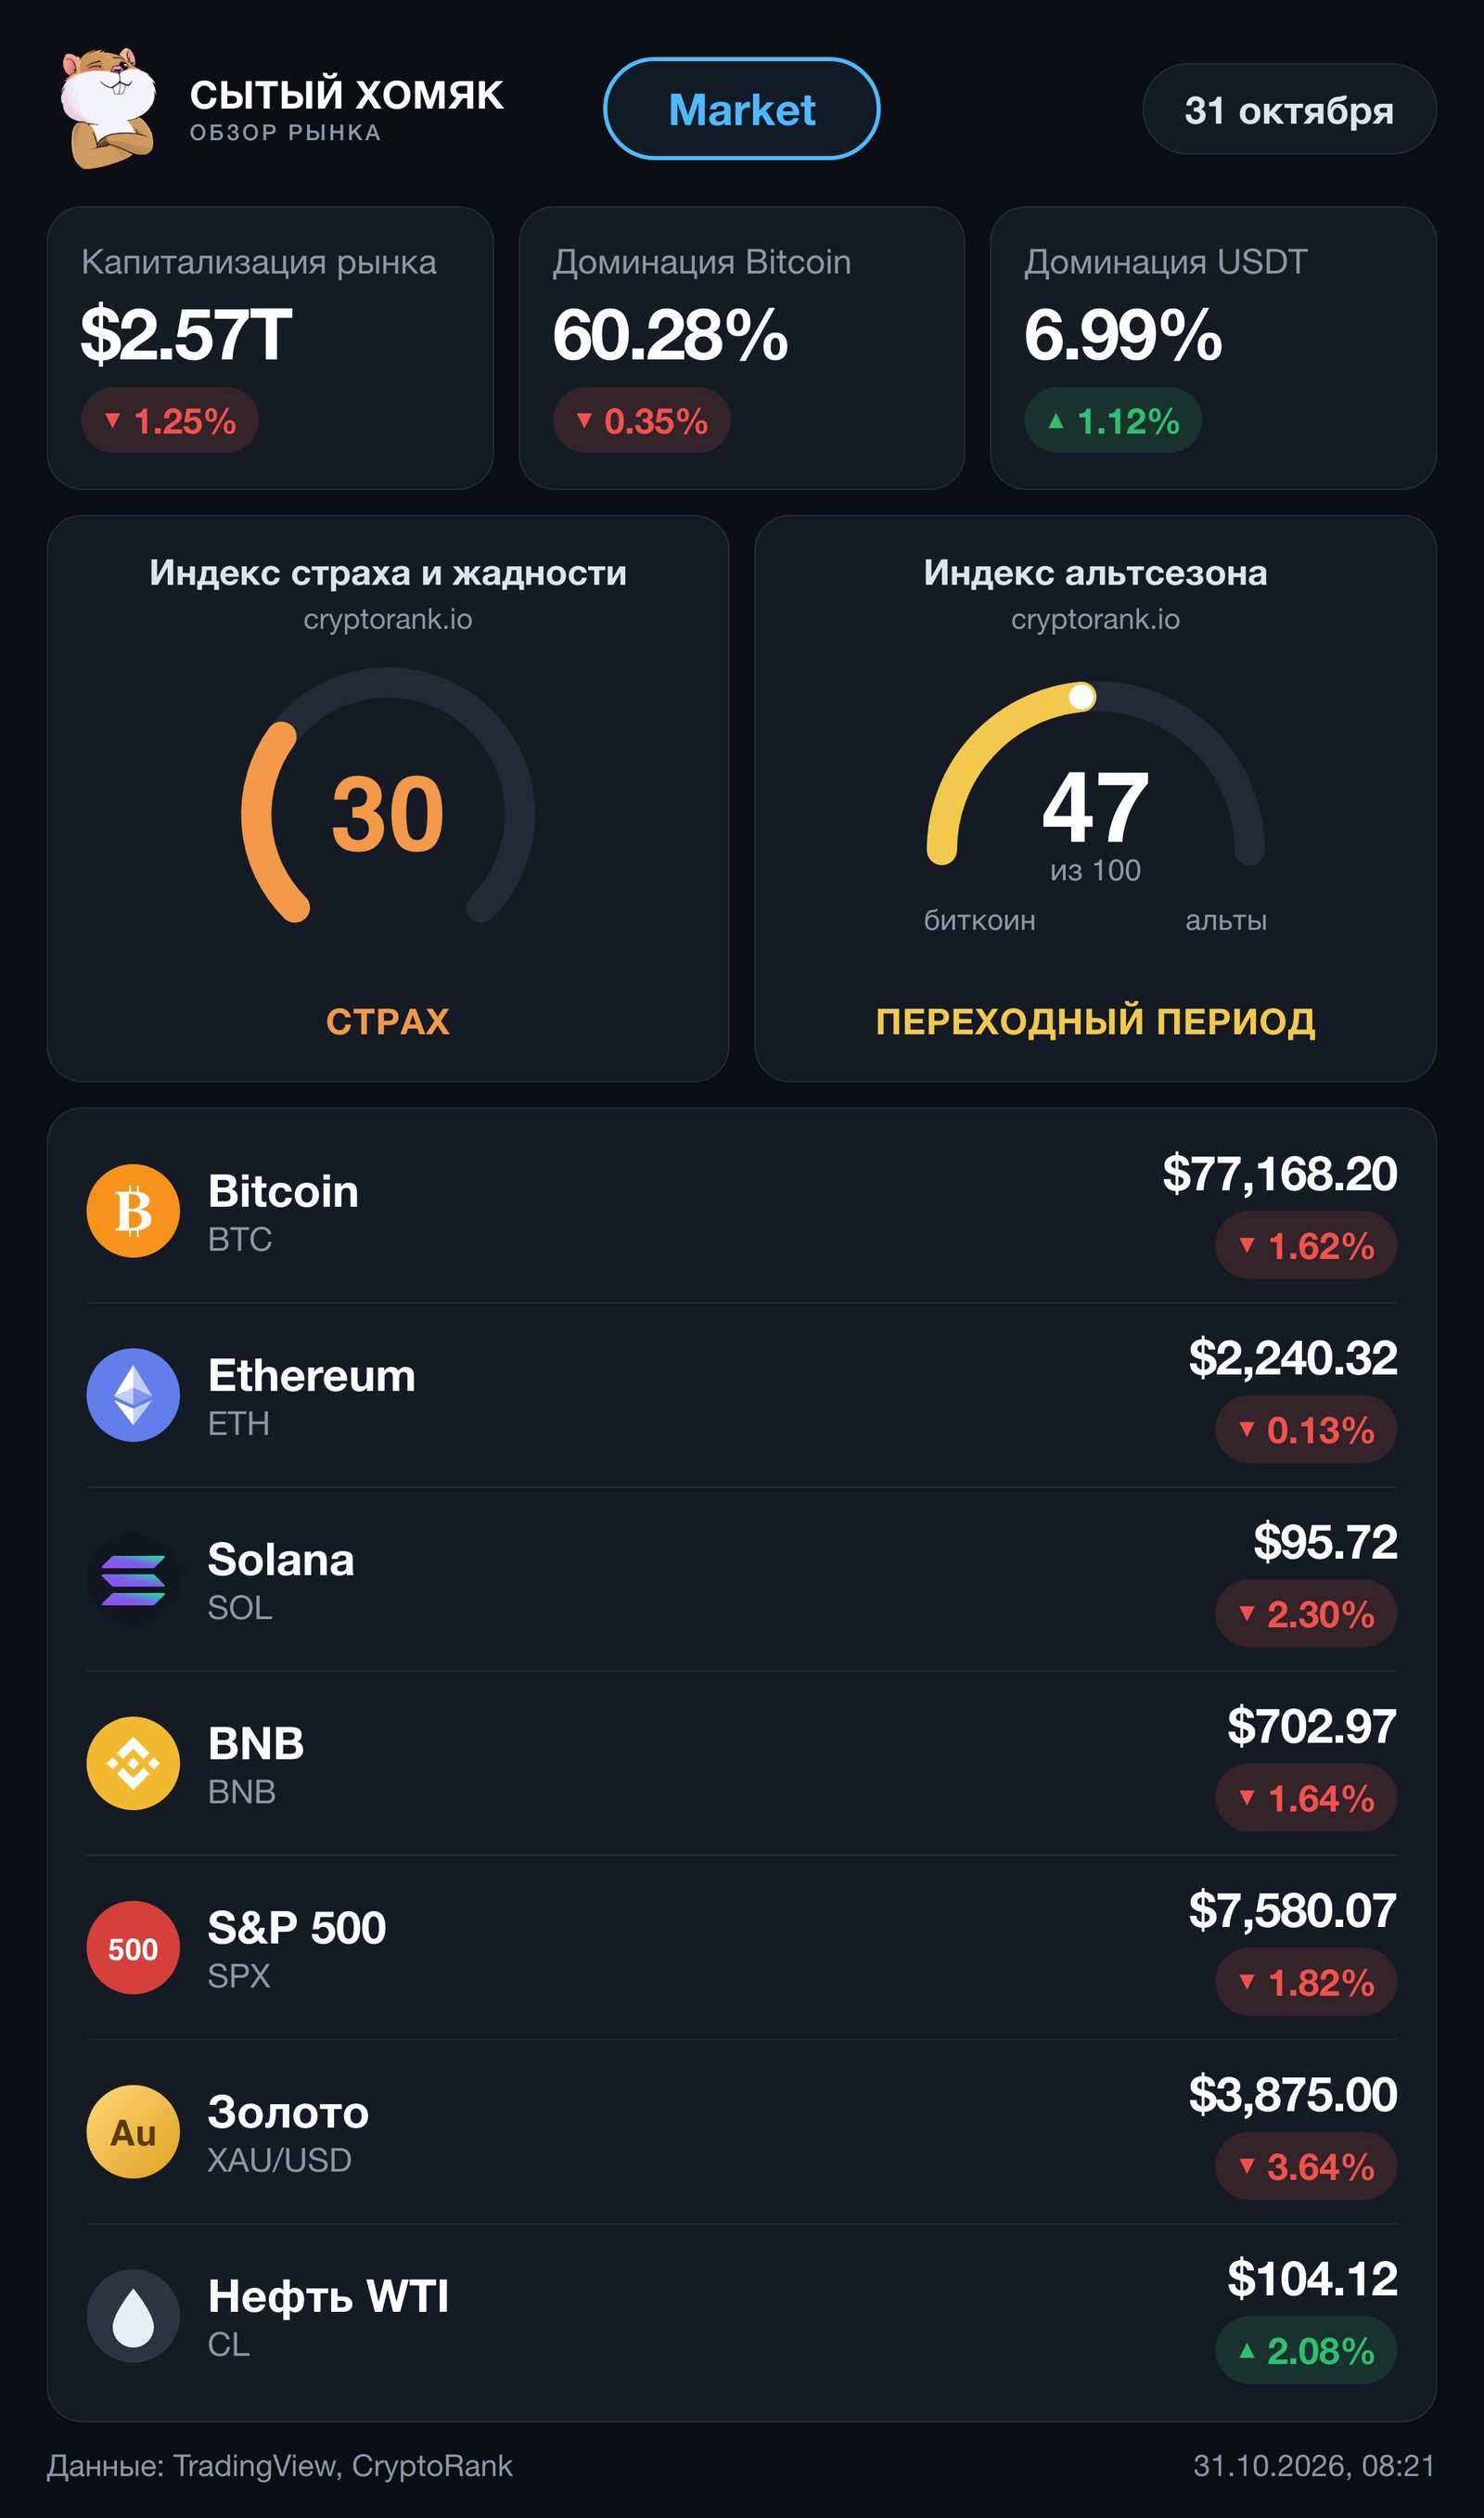
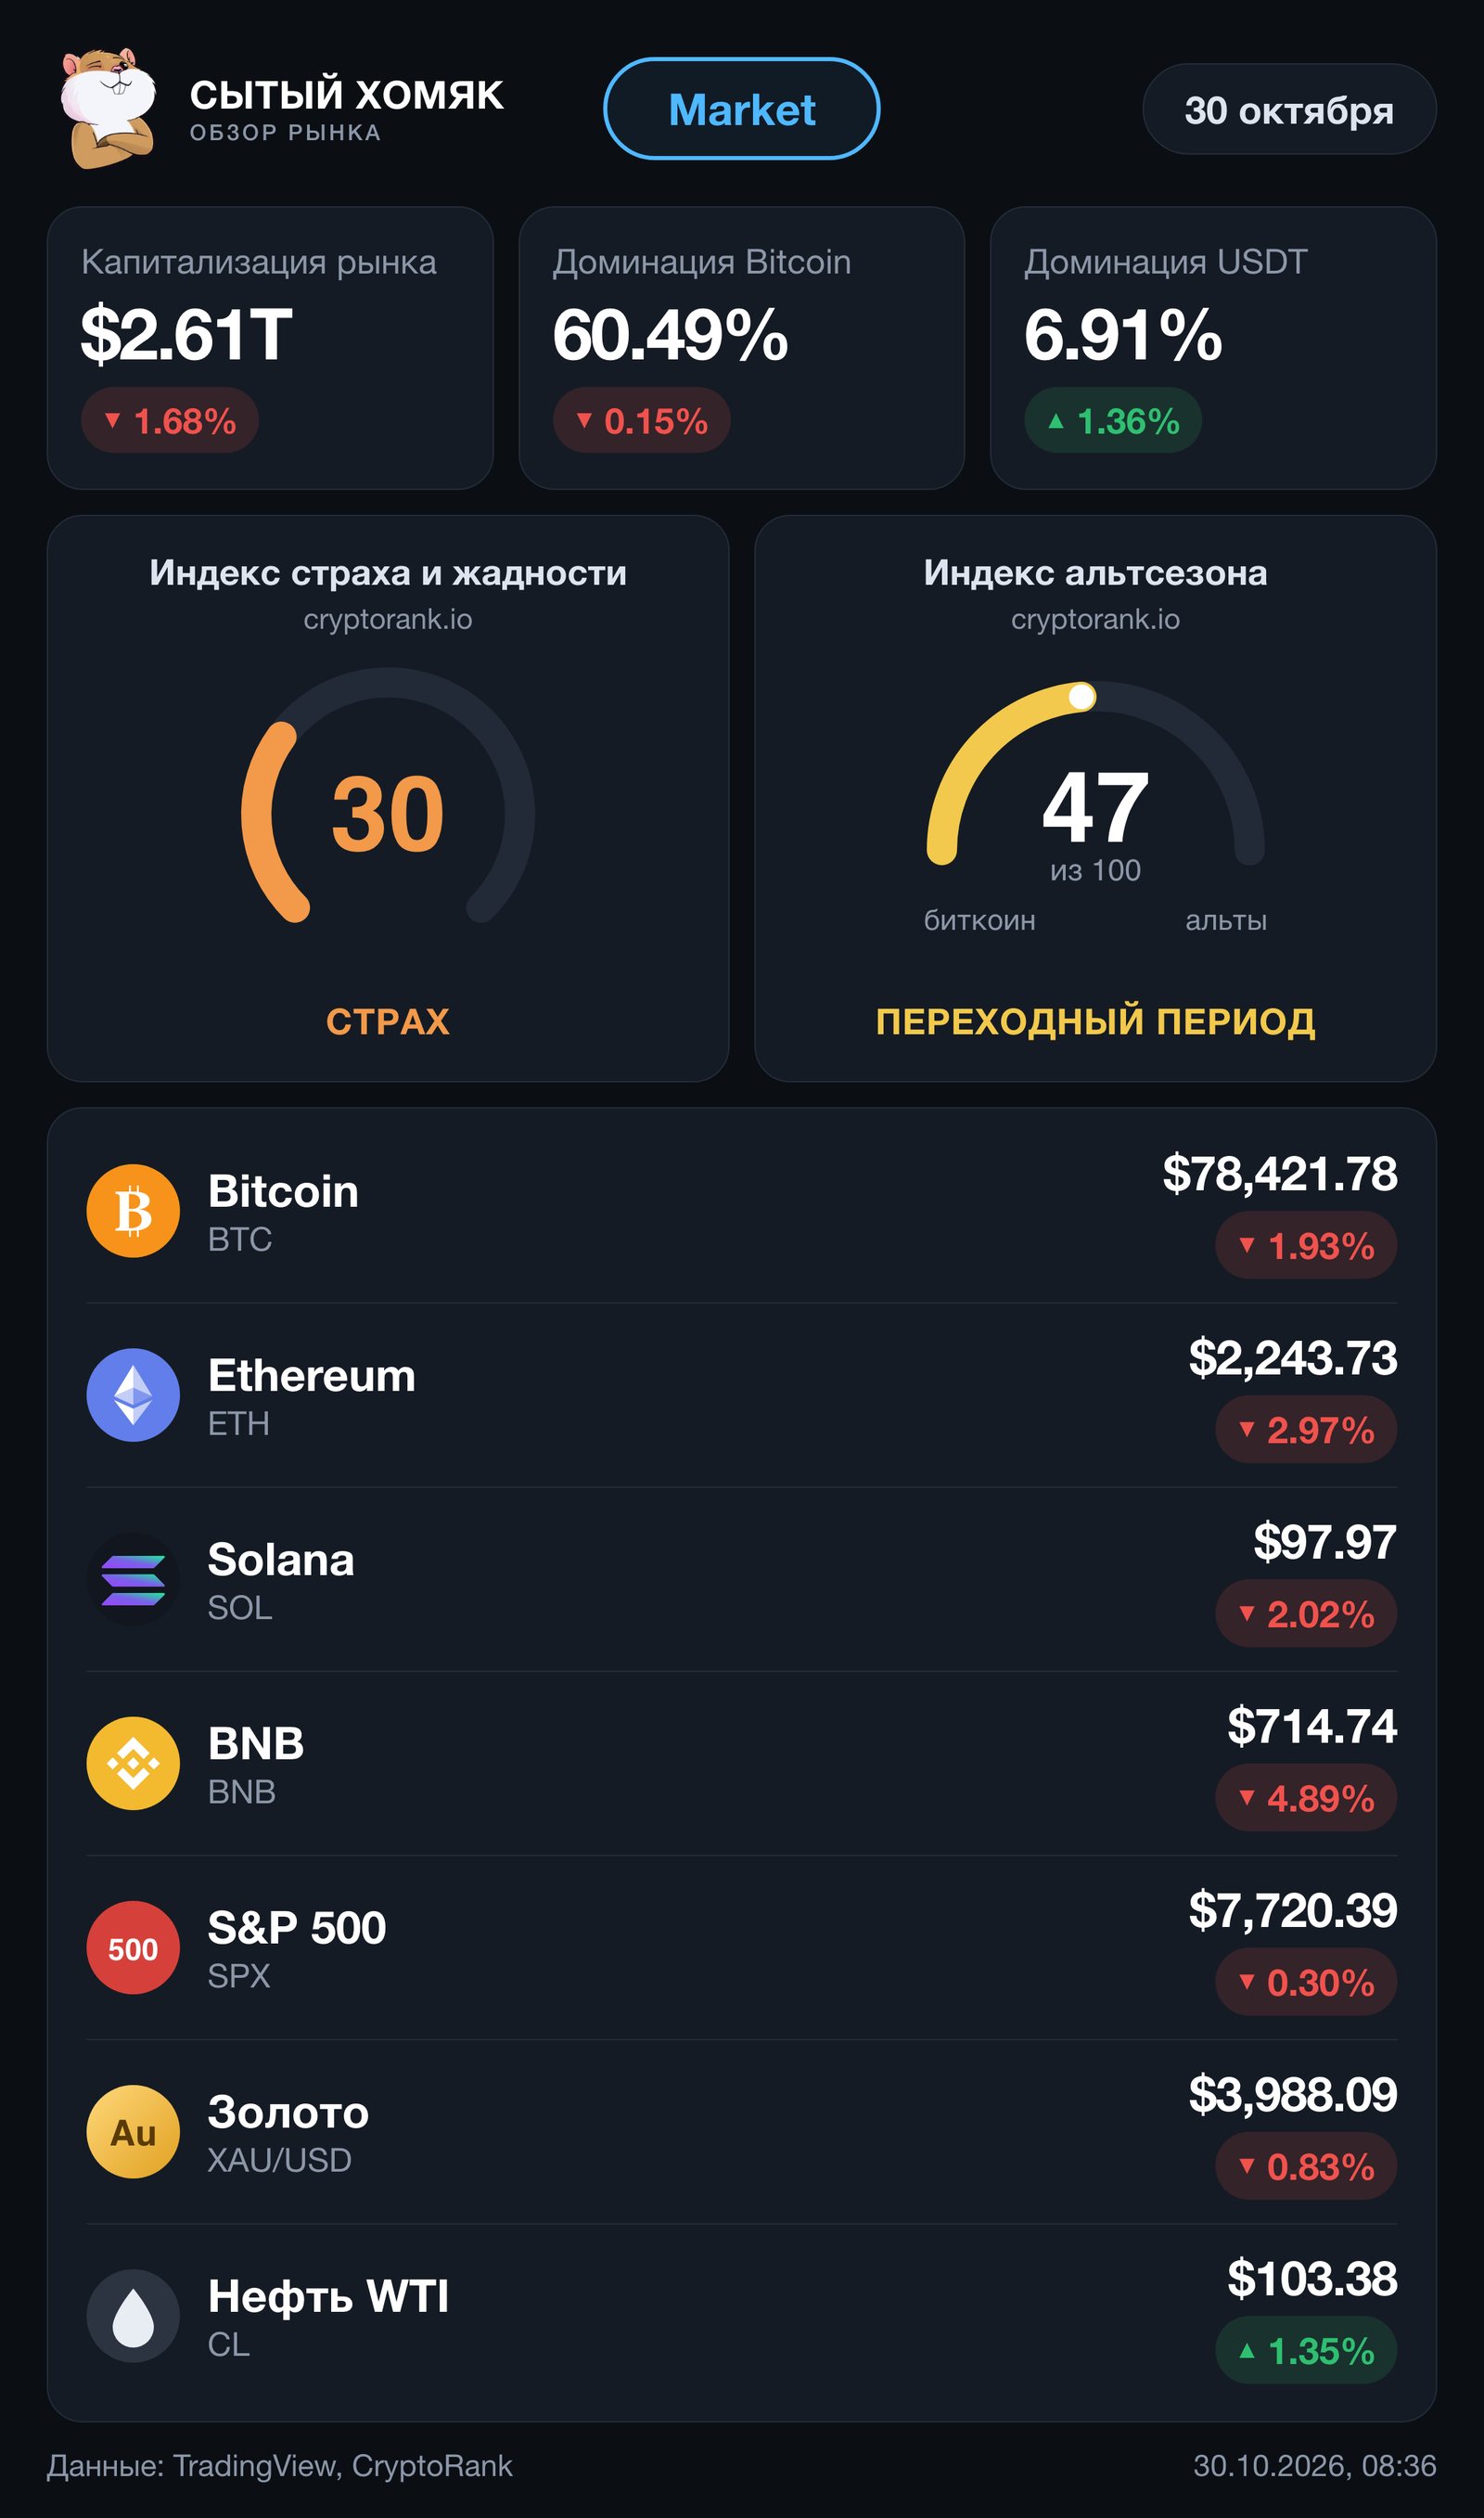
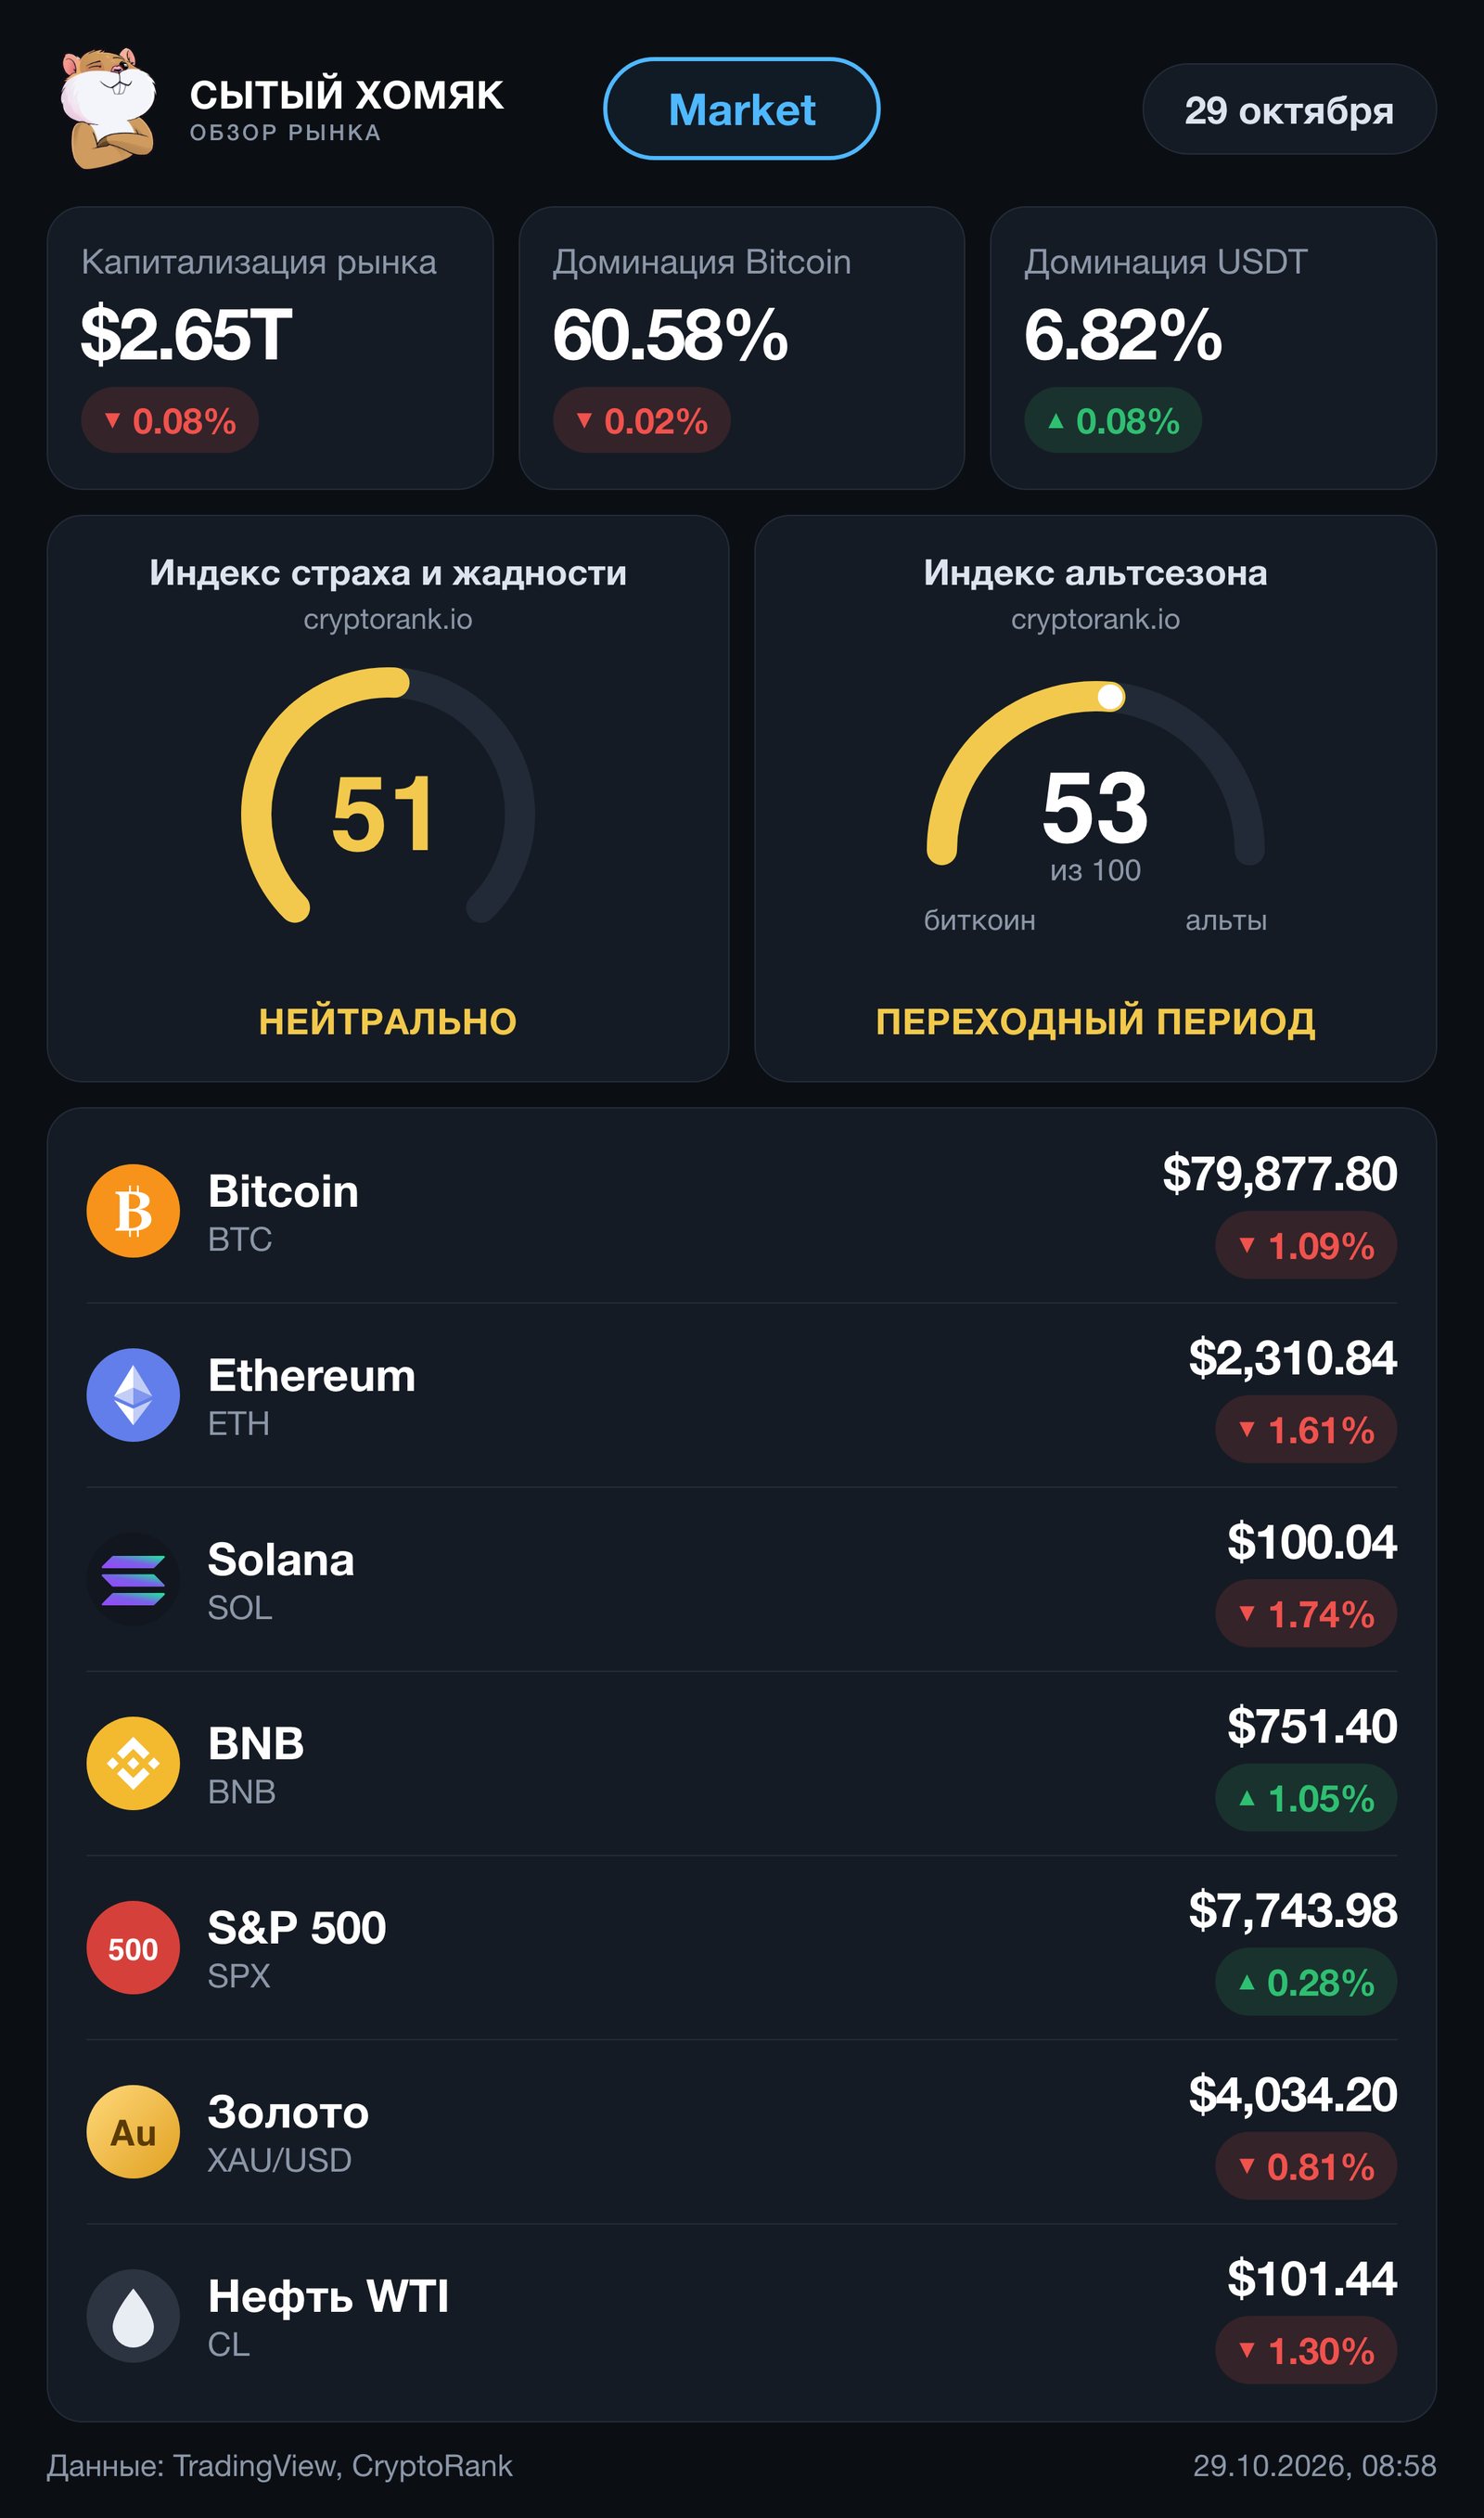
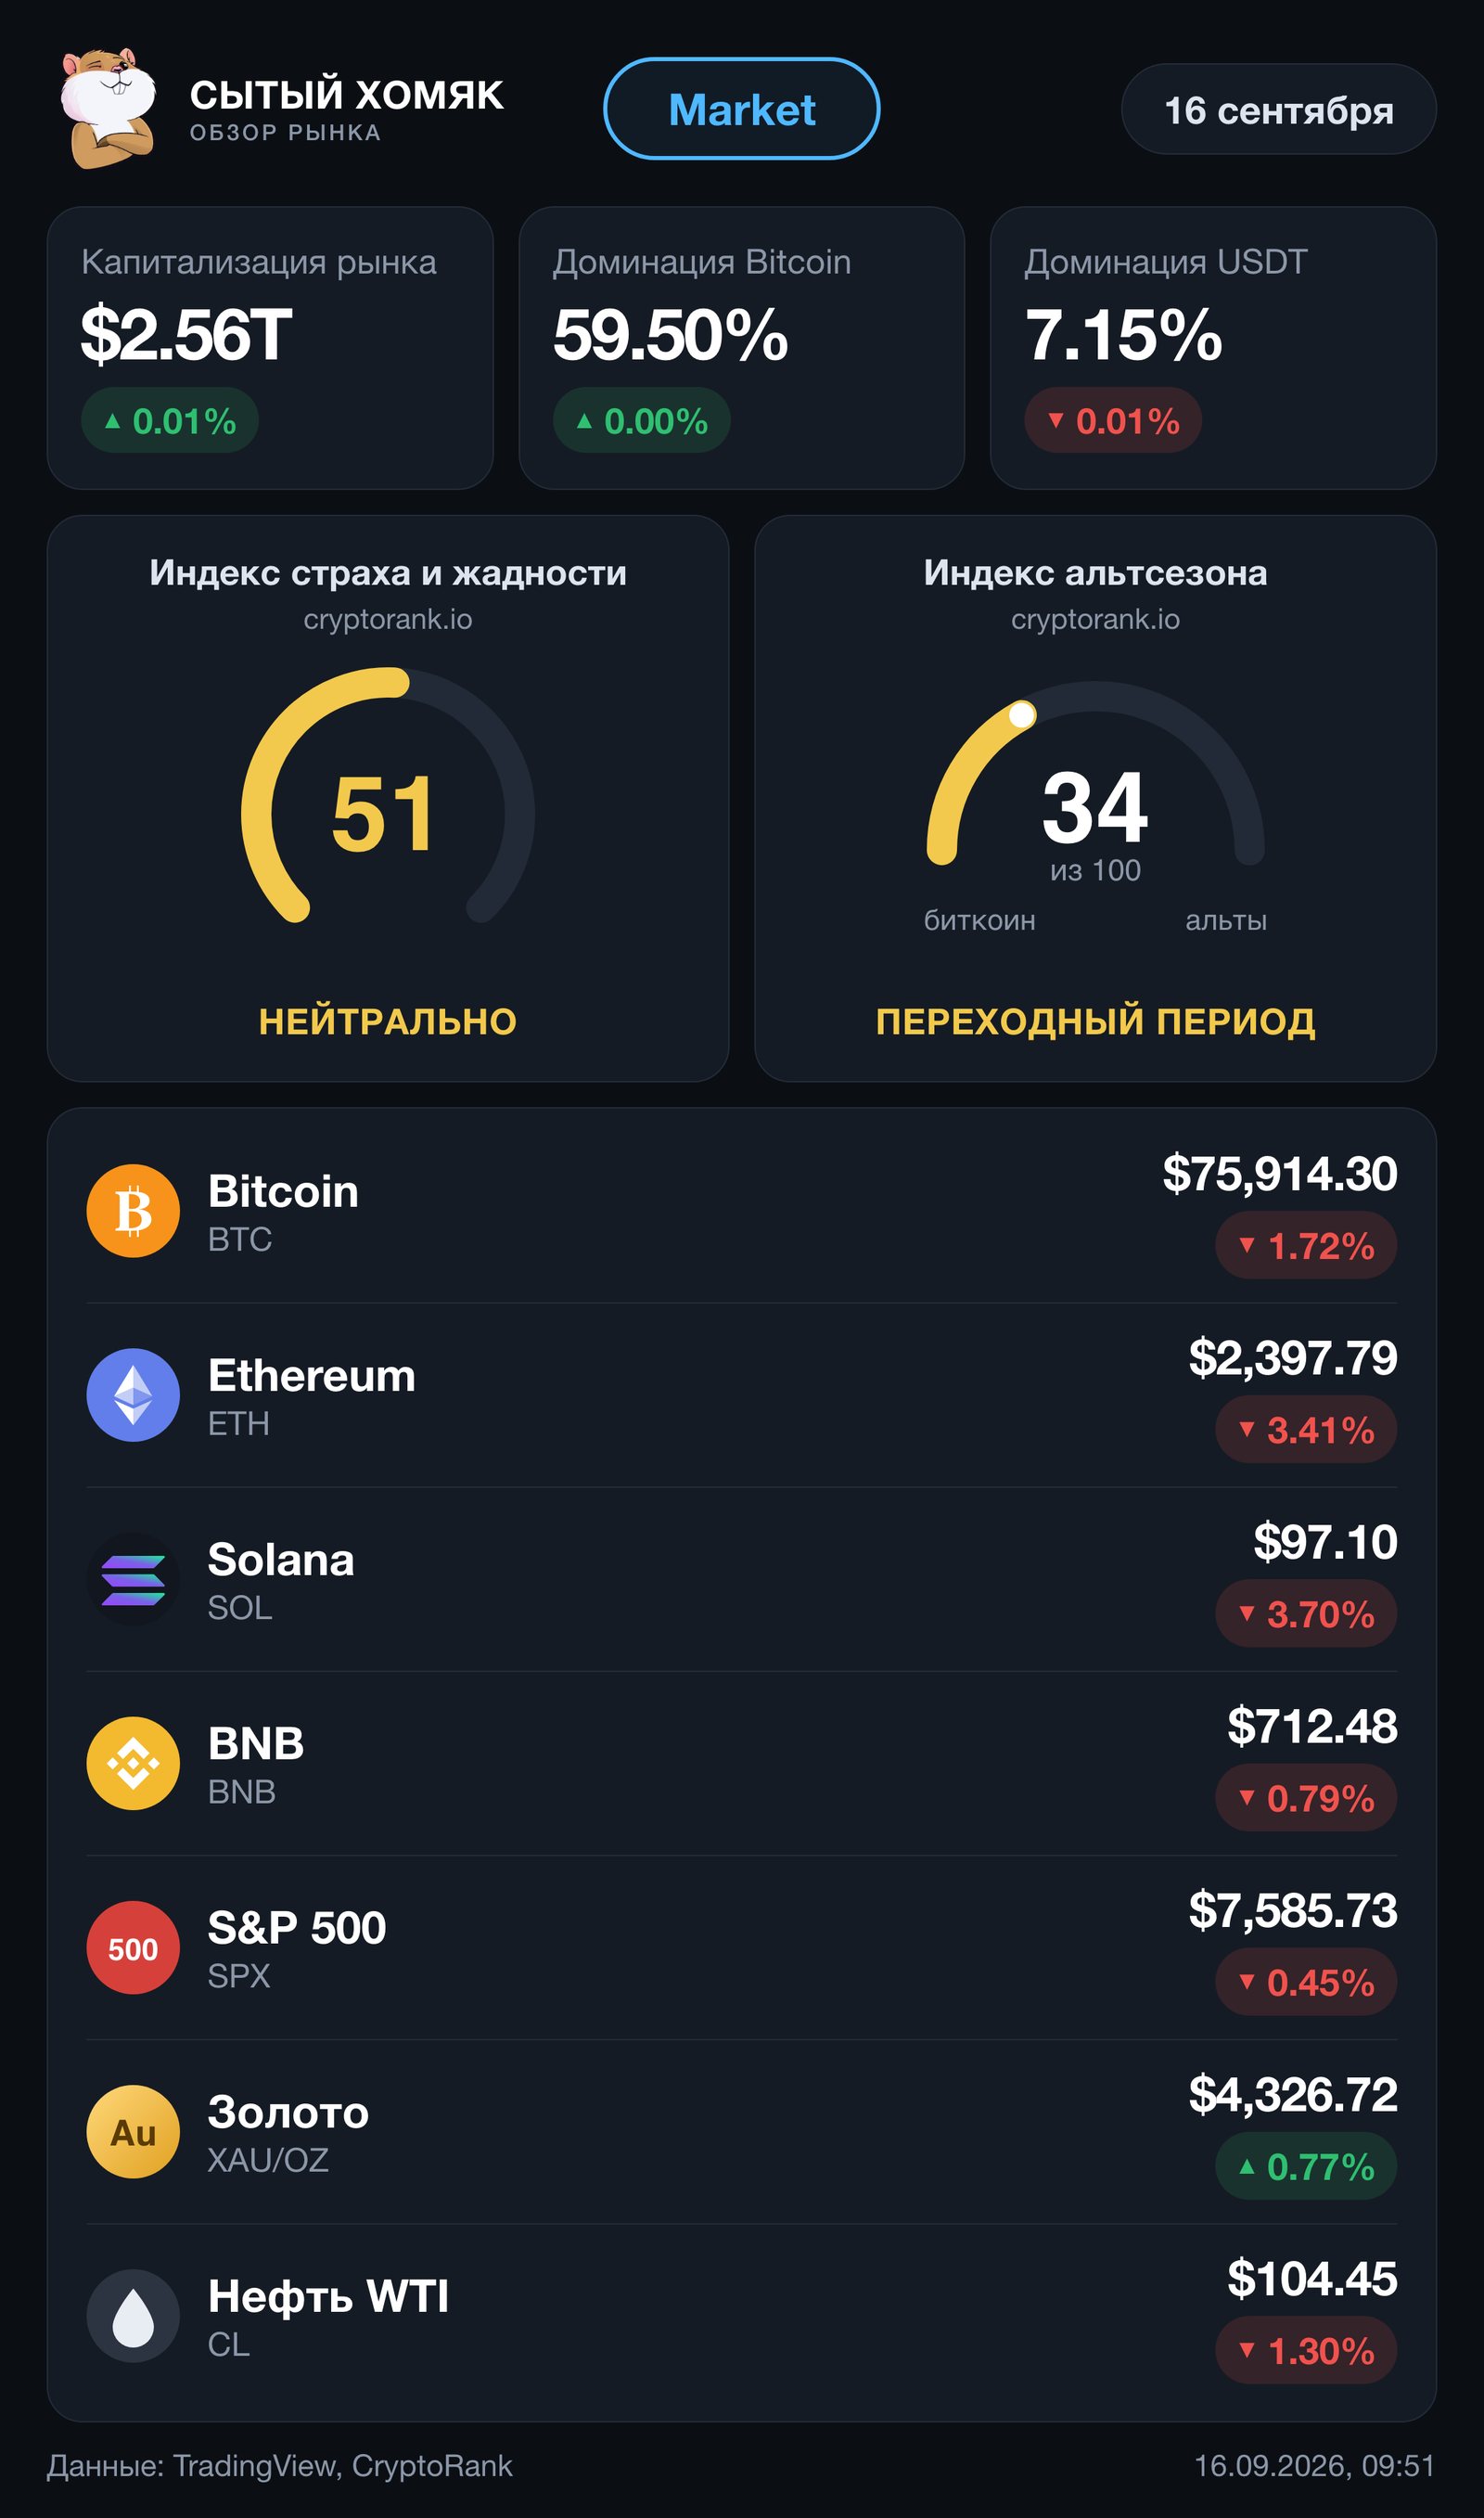
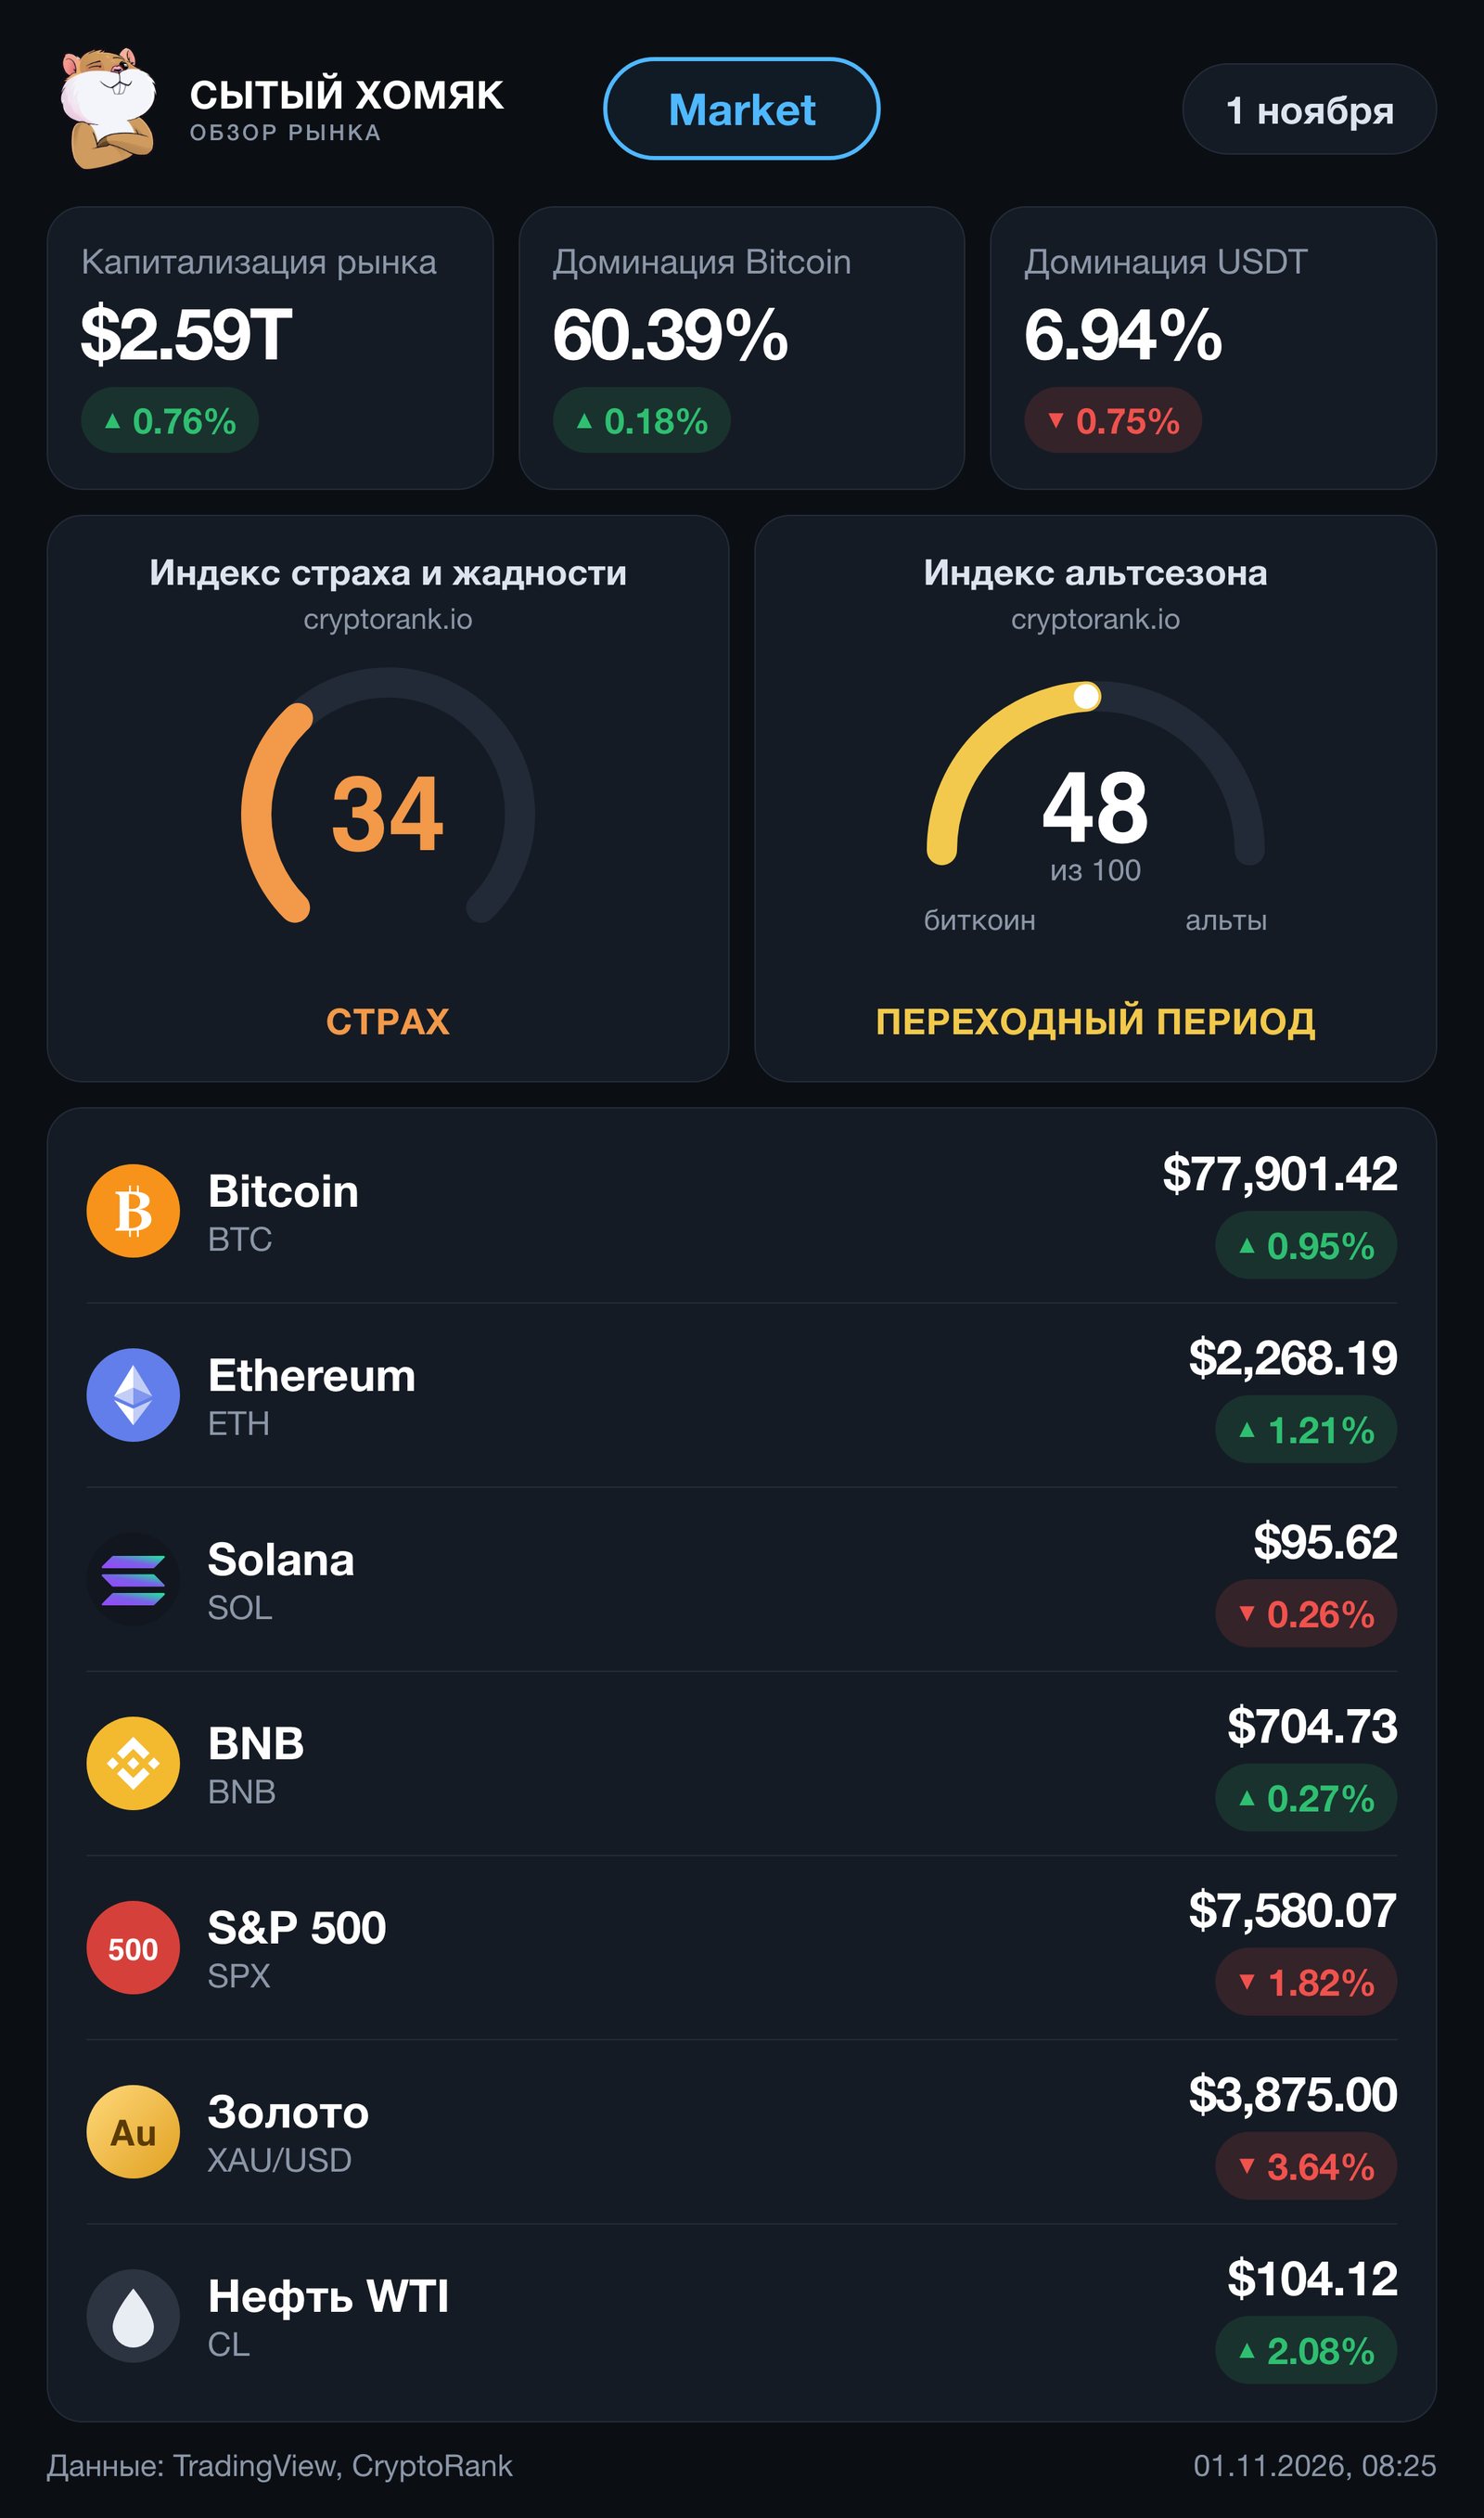
The Well-Fed Hamster crypto club wanted to give its community a market snapshot every day as a single picture, because a picture in Telegram opens on a phone and on a desktop alike. The card’s contents were fixed at the start and do not change without a separate decision: market cap, BTC and USDT dominance, the fear and greed index, the altcoin season index, and seven rows on the right: BTC, ETH, SOL, BNB, S&P 500, gold, WTI oil. Nobody has time to assemble this by hand every morning, and the numbers must not be wrong: the people reading them trade.
Why, and what the idea was
The idea: not a service and not a bot, but a daily scheduled task with an agent. Scripts fetch the figures, a browser draws the picture, and the agent does what scripts cannot: reads the indexes off a site that blocks automated requests, looks at the scripts’ warnings and writes a short caption on what went up and what went down. Vertical format, dark background, light-blue accent, the club’s logo in the header.
The main decision along the way: where to take daily percentages from. On TradingView the change field for crypto is counted from midnight UTC, not over a day: on the first day it gave +0.43% for BTC while the day was -2.09%. For coins we took the true 24-hour field (checked against CoinGecko: -2.09% versus -2.08%). Market cap and dominance have no such field, so the script stores today’s values in a state file and compares against them tomorrow. For gold and oil we first switched to futures, because spot lied about the sign, then decided to show spot quotes only and moved gold back to spot. Oil did not work that way: there is no public spot market for WTI, and the “oil price” in the news is the front-month future. Oil stayed a future.
How it went
| Stage | What happened |
|---|---|
| Day 1 | Fetch and render scripts, the club’s logo in the header, the first production run. The top row showed +0.01% / 0.00% / -0.01%: the baseline came from a debug run the same morning. The caption said so plainly, no other number was substituted |
| Day 2 | The top row’s percentages became real on their own: the baseline was now yesterday’s run. The CryptoRank widgets had moved, the numbers were read from a full screenshot. The same day we caught gold: +1.06% on the card against -0.82% for the real day. Switched to the future |
| Day 3 | Worked out where gold and oil come from and why their percentages are of a different nature: for futures the change is from the previous session’s close, not over 24 hours |
| Day 4 | Gold moved back to spot under the “spot quotes only” rule. Seven spot symbols for oil tried: six do not exist in this API, the only working one sits 3.4% off the market. Oil stayed a future |
| Day 5 | The scheduled task missed its slot, the card was assembled by hand, then the task started after all and built a second one that day. The state file already held the morning’s numbers, the real daily percentages were pulled from the morning’s HTML |
| Every day after | Routine runs, zero script warnings. The CryptoRank widgets shift four more times, the numbers come from a full screenshot each time |
| Six weeks in | After the clocks changed, the run moved from 09:00 to 08:00 Kyiv time |
Tools and method
The fetch script pulls values from TradingView’s free scanner API with no key: CRYPTOCAP:TOTAL, BTC.D and USDT.D for the top row, CRYPTO:BTCUSD and the other coins, SP:SPX, TVC:GOLD, NYMEX:CL1!. Three attempts per symbol; if a source does not answer, the script prints a warning instead of staying silent. The fear and greed and altcoin season indexes come from cryptorank.io: Cloudflare returns 403 to curl, so the agent opens the site in Chrome, reads the numbers off the screen and passes them to the script as parameters.
The render script builds HTML with the data and captures it with headless Chrome: vertical format, 2160 by 3664 at double scale, dark background, light-blue accent, both gauges fill clockwise, Solana and BNB use their official logo outlines. The script trims the backing off the club’s logo and fits it into the header; the date in the header is filled in automatically.
The scheduled task every morning: the agent reads the indexes, runs both scripts, checks the warnings and hands over the picture with a short note. No server needed, everything runs on one machine.
Result
47 cards in 47 days, one a day, no gaps. Each 2160 by 3664, about 470 KB, readable on a phone. After the gold fix and the move to true 24-hour changes, the numbers were checked against independent sources: BTC +0.78% ours versus +0.88% on CoinGecko, ETH +1.91 versus +1.93, SOL +2.86 versus +2.90, BNB +1.87 versus +1.87.
What we did not do, and why. The script still has no guard against a second run on the same day: it overwrites the state file on every run, and a second run would zero out the top row’s percentages. The hole is known, it fired once, the workaround is written down, the fix is waiting for a decision. Our BTC dominance differs from the one in CryptoRank’s header, by 2.3-2.5 points in three checks: different methods, not an error, the card sticks to TradingView and does not mix sources. S&P 500 in the Kyiv morning shows yesterday’s close because the US market is still closed, and on weekends S&P, gold and oil repeat Friday’s close.
Mistakes and what we took from them